Skill Page - Basics of ECG
23 JAN 2015
ELECTROCARDIOGRAM
Mr Tijo Mathew, EMN Staff
.bmp)
ELECTROCARDIOGRAM-ECG
Graphic recording of electric potentials generated by the heart.
ECG Leads
12 ECG leads record the difference in potential between electrodes placed on the surface of the body.
6 extremity (limb) leads & 6 chest (precordial) leads
Limb leads
3 bipolar leads- I,II & III
3 unipolar leads- aVR, aVL & aVF
Chest leads
In Precordial Leads positive electrode is placed on the chest(V1-V6)
The Leads record Electrical changes of the Heart in Cross sectional plane
Chest Lead Placement
V1: fourth intercostal space to right of sternum
V2: fourth intercostal space to left of sternum
V3: directly between leads V2 and V4
V4: fifth intercostal space at left midclavicular line
V5: level with V4 at left anterior axillary line
V6: level with V5 at left midaxillary line
.bmp)
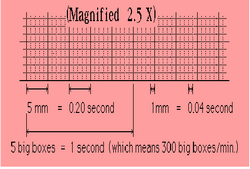
E C G Paper
.bmp)
Small squire = 1mm
Large squire = 5 mm
Speed
25mm = 1sec
Small (1mm) = 1/25th sec , = 0.04 sec
Large (5mm)= 0.04 x 5, = 0.2 sec
ECG Waves
P wave: the sequential activation (depolarization) of the right and left atria
QRS complex: right and left ventricular depolarization (normally the ventricles are activated simultaneously)
ST-T wave: ventricular repolarization
.bmp)
.bmp)
.bmp)
.bmp)
Small square = 0.04 sec.
Large square = 5 small square = 0.2sec.
One second = 5 large square
One minute = 300 large square
ECG Intervals
PR interval: Time interval from onset of atrial depolarization (P wave) to onset of ventricular depolarization (QRS complex) 3-5small squares
QRS duration: Duration of ventricular muscle depolarization.<0.12s
QT interval: duration of ventricular depolarization and repolarization
RR interval: duration of ventricular cardiac cycle (an indicator of ventricular rate)
PP interval: duration of atrial cycle (an indicator or atrial rate)
.bmp)
Interpretation of an ECG
1.Rate 6.QRS complex
2.Rhythm 7.ST Segment
3.Axis 8.T wave
4.P waves 9.U wave
5.PR interval 10.QT interval
Rate determination for regular rhythm
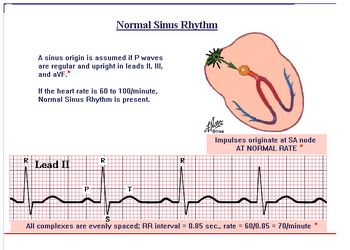
If the heart rate is regular, 300/ no of large squares or 1500/ no. of small squares.
.bmp)
.bmp)
Heart Rate
1500N.of small squires OR 300N.of Large squires
.bmp)
.bmp)
10 Second Rule - Rate determination for Irregular rhythms
As most ECGs record 10 seconds of rhythm per page, one can simply count the number of QRS present on the ECG and multiply by 6 to get the number of beats per 60 seconds.
This method works well for irregular rhythms.
What is the heart rate?

33 x 6 = 198 bpm
Cardiac axis
General direction of wave of depolarization through the ventricle.
Top right hand corner to bottom left hand corner.
Axis deviation
Lead I
Positive QRS-normal.
Left axis deviation
+ve QRS
Right axis
_ve QRS
Lead II
Positive QRS-normal
_ve QRS
Left axis deviation
Inferior MI
Left anterior hemiblock
Ventricular tachycardia
Right axis deviation
Right ventricular hypertrophy
Anterolateral MI
Dextrocardia
Left posterior hemiblock
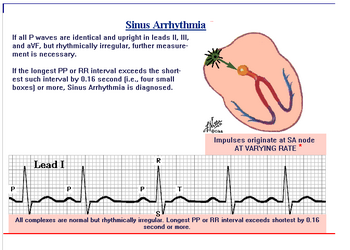
Arrhythmia
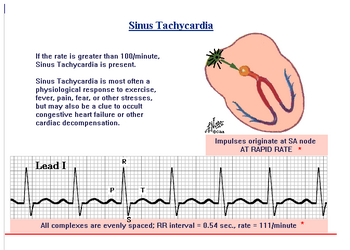
Tachycardia -HR>100/min
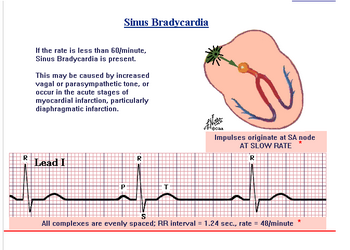
Bradycardia -HR<60/min
Unusual Complexes
P WAVE ABNORMALITIES
Bifid P waves seen with left atrial enlargement.
Peaked p waves seen with right atrial enlargement.
P wave invertion seen with ectopic atrial and junctional rhythms.
QRS complex
QRS complex wide
Causes
- Pacemaker
- Hyperkalemia
- Right or left BBB
- Ventricular fibrilation
- Ventricular tachycardia
QRS complex narrow
Causes
- Svt
- Atrial flutter
- Atrial fibrilation
ST segment elevation
Causes
- Acute MI
- Pericarditis
- Left BBB
- Raised intracranial pressure
T wave
Positive deflection after each QRS complex
It represents ventricular repolarisation.
INVERTION OF T WAVES
Normal finding in children
Myocardial ischemia or infarction
BBB
Ventricular hypertrophy
Recent skills
- Skill Page - Lasix infusion
- Skill Page - Cervical Collar
- Skill Page - Triage
- Skill Page - Female Catheterization
- Skill Page - Catheterisation
- Skill Page - Braden Scale
- Skill Page - Safe Injection Practices
- Skill Page - Basics of ECG
- Skill Page - SOLUMEDROL INFUSION
- Skill Page - Oxygen Therapy


